Technology Expense Management: Complete Guide for Enterprise Leaders (Why Telecom is Your Hardest Problem)
 Socium Editorial Team
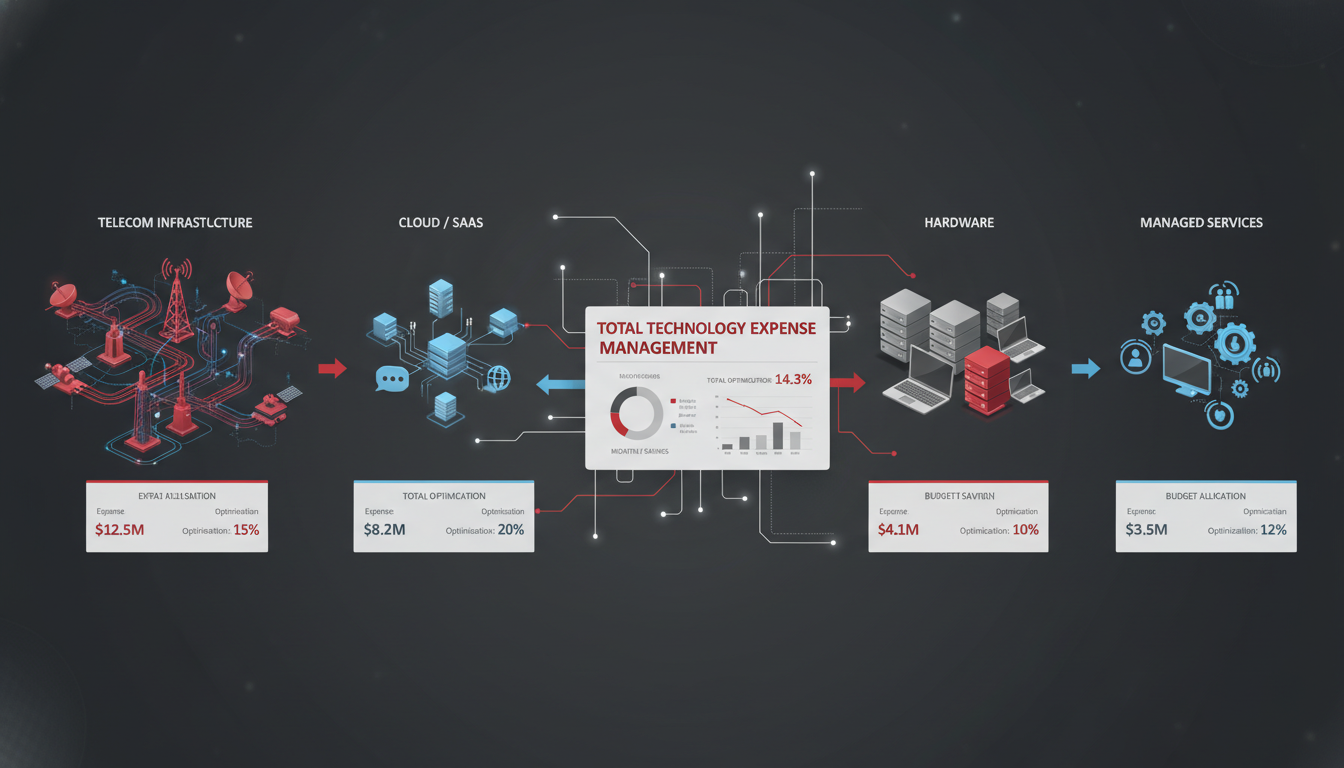
Enterprise technology expenses now consume 6.2% of total company revenue on average, representing one of the fastest-growing cost categories in modern business. For large enterprises, technology spending frequently exceeds $50 million annually, yet most organizations lack systematic visibility into where those dollars go or how to optimize them.
Technology expense management (TEM) has evolved far beyond simple IT asset tracking. Today's TEM encompasses four major categories: telecom services, SaaS and cloud platforms, hardware and infrastructure, and IT professional services. Each category presents unique management challenges, different optimization opportunities, and varying levels of complexity.
Here's what most CIOs discover: while cloud and SaaS expenses draw considerable attention, telecom remains the most complex category to manage and consistently delivers the highest optimization ROI—typically 25-35% in cost reduction. Understanding why telecom is uniquely challenging, and how it fits within your broader technology expense management strategy, is critical for maximizing your return on TEM investments.
Technology Expense Management: Executive Summary
Technology expenses now consume 6.2% of enterprise revenue across four major categories: telecom (highest optimization ROI at 25-35%), SaaS/cloud (fastest growth at 20-30% annually), hardware (declining as % of budget), and IT professional services. Telecom remains the most complex category requiring specialized expertise, while other categories can often be managed in-house with proper tools and governance.
Key Takeaways:
- Four TEM categories with distinct optimization approaches: Telecom, SaaS/Cloud, Hardware, IT Services
- Telecom delivers highest ROI (25-35% savings) but requires specialized expertise due to multi-carrier complexity
- SaaS/cloud fastest-growing category (20-30% YoY) manageable in-house with FinOps platforms and governance
- Multi-carrier telecom environments (3-7 carriers typical) create complexity absent from other technology categories
- Outsourced TEM recommended for telecom ($1M+ spend), in-house management suitable for SaaS/cloud/hardware
In This Guide:
- What is Technology Expense Management?
- The 4 Categories of Technology Expense Management
- Why Telecom is the Most Complex TEM Category
- TEM Maturity Model: Where Is Your Organization?
- In-House vs. Outsourced TEM by Category
- Building Your Integrated TEM Strategy
- Integration Challenges and Solutions
- The Future of Technology Expense Management
- Case Study: Integrated TEM Approach
- Getting Started with Technology Expense Management
What is Technology Expense Management?
Technology expense management (TEM) is the systematic process of tracking, analyzing, optimizing, and governing all technology-related spending across an organization. TEM encompasses procurement, contract management, usage monitoring, invoice processing, vendor relationship management, and continuous cost optimization for all technology services and assets.
The scope of TEM has expanded dramatically over the past decade. What began as basic inventory tracking for desktop computers and software licenses now includes:
- Telecom services: Voice, data, mobile, network, unified communications, contact center platforms—requiring systematic expense auditing to catch billing errors in 85% of invoices
- Cloud and SaaS platforms: Infrastructure as a Service (IaaS), Platform as a Service (PaaS), Software as a Service (SaaS)
- Hardware and infrastructure: Servers, storage, networking equipment, endpoints, peripherals
- IT professional services: Consulting, managed services, outsourcing, professional development
Why TEM Matters More Than Ever
Three converging trends have elevated technology expense management from a back-office function to a strategic imperative:
Explosive cost growth. Technology spending is rising 8-12% annually at most enterprises, far outpacing overall budget growth. SaaS applications alone have increased from an average of 8 per company in 2015 to 130+ in 2025. Cloud infrastructure costs are doubling every 18-24 months for high-growth organizations.
Increasing complexity. The average enterprise now manages 3-7 telecom carriers, 2-3 cloud providers, 100+ SaaS vendors, and multiple hardware suppliers. Each vendor brings unique contract terms, billing formats, and management requirements. This complexity creates visibility gaps where costs spiral undetected.
Executive accountability. CFOs and boards now scrutinize technology spending with the same rigor applied to headcount and facilities. CIOs face pressure to demonstrate ROI for every technology investment while simultaneously supporting digital transformation initiatives that require increased spending.
TEM vs. IT Asset Management: What's the Difference?
Technology expense management and IT Asset Management (ITAM) are related but distinct disciplines:
ITAM focuses on inventory and lifecycle management of physical and digital assets. ITAM answers questions like: What do we own? Where is it? Who's using it? When does it need replacement? ITAM is primarily an operational discipline focused on compliance, security, and utilization.
TEM focuses on the financial dimension of technology spending. TEM answers: What are we paying? Are we getting value? How can we reduce costs? Where are we overspending? TEM is a strategic financial discipline focused on optimization, vendor management, and cost reduction.
The best technology organizations integrate ITAM and TEM, using asset data to inform financial decisions and using cost data to guide asset lifecycle planning. However, the skillsets, tools, and organizational ownership often differ significantly.
The 4 Categories of Technology Expense Management
Enterprise technology spending breaks down into four major categories, each with distinct characteristics, optimization opportunities, and management approaches. Understanding these differences is critical for prioritizing your TEM efforts and allocating resources effectively.
1. Telecom Expense Management
What It Covers:
- • Voice services (POTS, PRI, SIP trunking)
- • Data and internet connectivity (MPLS, SD-WAN, DIA)
- • Mobile services (cellular, MDM)
- • Network services (VPN, VPLS, Ethernet)
- • Unified Communications (UCaaS, telephony)
- • Contact Center platforms (CCaaS)
- • Collaboration tools (conferencing, messaging)
Key Metrics:
- • Typical spend: $800-$2,500 per employee annually
- • Optimization potential: 25-35% savings
- • Billing error rate: 73% of bills contain errors
- • Average contract term: 3-5 years
- • Vendor complexity: 3-7 carriers typical
Telecom Complexity Factors:
Multi-carrier environments. Unlike SaaS or cloud, where enterprises typically consolidate to 1-3 providers, telecom environments commonly involve 3-7 different carriers. Why? Geographic coverage requirements, redundancy needs, legacy contract obligations, and carrier-specific service strengths force organizations into complex multi-vendor environments. Each carrier brings different billing formats, contract terms, and management interfaces.
Complex contract structures. Telecom contracts are notoriously intricate, often running 40-60 pages with hundreds of line items. Master Service Agreements (MSAs) layer on top of individual service orders, each with unique pricing schedules, term commitments, early termination fees, and auto-renewal clauses. Even experienced procurement teams struggle to identify unfavorable terms buried in telecom contracts.
Usage-based pricing variability. Unlike fixed SaaS subscriptions, telecom costs fluctuate based on usage patterns, overage charges, international roaming, and peak-period pricing. This variability makes budgeting challenging and creates opportunities for cost overruns that go undetected for months.
Regulatory compliance complexity. Telecom services carry unique regulatory burdens: FCC compliance, state and local telecom taxes (which vary dramatically by jurisdiction), international data sovereignty regulations, E911 requirements, and CALEA compliance. These regulatory requirements add cost and complexity absent from other technology categories.
Legacy infrastructure debt. Many enterprises still maintain POTS lines installed in the 1990s, TDM circuits awaiting IP migration, and outdated PBX systems requiring specialized knowledge. This legacy infrastructure creates technical debt that complicates optimization and increases costs.
Management Approach:
Telecom expense management typically requires specialized expertise unavailable in-house. The combination of technical complexity, carrier-specific knowledge, contract negotiation leverage, and time-intensive auditing makes outsourced telecom expense management the preferred approach for organizations with $1M+ annual telecom spend or multi-carrier environments.
2. SaaS and Cloud Expense Management
What It Covers:
- • SaaS applications (CRM, ERP, HRIS, etc.)
- • Infrastructure as a Service (AWS, Azure, GCP)
- • Platform as a Service (development platforms)
- • Collaboration and productivity suites
- • Security and compliance SaaS
- • Data analytics and BI platforms
- • Marketing and sales automation tools
Key Metrics:
- • Typical spend: $500-$1,800 per employee annually
- • Growth rate: 20-30% year-over-year
- • Optimization potential: 15-25% savings
- • Average applications: 130+ SaaS apps
- • Shadow IT rate: 40-60% undiscovered apps
SaaS/Cloud Complexity Factors:
License sprawl and duplication. The democratization of software procurement means individual teams now purchase SaaS tools without IT oversight. This creates license sprawl where organizations pay for overlapping functionality across multiple tools, inactive users continue accruing charges, and nobody maintains a comprehensive inventory.
Shadow IT challenges. Studies show 40-60% of SaaS applications in use at large enterprises are unknown to IT departments. These shadow IT purchases create security risks, compliance gaps, and missed optimization opportunities. Unlike telecom (where all services typically flow through IT), SaaS purchasing is distributed across departments.
Usage optimization complexity. Cloud providers offer thousands of service configurations and pricing models. Without deep expertise, organizations routinely over-provision resources, select suboptimal pricing models (on-demand vs. reserved instances), and fail to rightsize workloads. Cloud costs can spiral 30-40% above optimized levels without active management.
Multi-cloud environments. Many enterprises now operate in 2-3 public clouds plus private cloud infrastructure. Each cloud platform has unique pricing models, management tools, and optimization strategies. This multi-cloud reality increases management complexity and makes cost comparison challenging.
Management Approach:
SaaS and cloud expense management is often manageable in-house using FinOps platforms and governance processes. Tools like Flexera, CloudHealth, and native cloud cost management features provide visibility and optimization recommendations. Organizations should focus on establishing governance (approval workflows, usage policies) and implementing automated tools for continuous monitoring. Outsourcing makes sense for massive scale (>$5M annual cloud spend) or complex multi-cloud environments.
3. Hardware and Infrastructure Expense Management
What It Covers:
- • Servers and data center equipment
- • Storage arrays and backup systems
- • Networking equipment (switches, routers, firewalls)
- • Endpoints (laptops, desktops, tablets)
- • Peripherals (monitors, printers, phones)
- • Facilities infrastructure (UPS, cooling)
Key Metrics:
- • Typical spend: $800-$1,500 per employee annually
- • Trend: Declining as % of IT budget (cloud shift)
- • Optimization potential: 10-15% through lifecycle optimization
- • Refresh cycle: 3-4 years for endpoints, 5-7 for servers
- • Management complexity: Moderate (well-established tools)
Hardware Complexity Factors:
Lifecycle management. Hardware requires careful lifecycle planning: procurement, deployment, maintenance, refresh, and disposal. Each phase involves financial decisions—lease vs. buy, extended warranties, upgrade timing, and disposal/buyback programs. Poor lifecycle management leads to premature replacements (wasted capital) or extended use past optimal refresh points (higher support costs, reduced productivity).
Depreciation and accounting complexity. Hardware assets require depreciation tracking, compliance with accounting standards, and coordination between IT and finance. Different asset classes have different depreciation schedules, and lease accounting (ASC 842/IFRS 16) has added complexity for hardware leasing programs.
Refresh cycle optimization. Determining optimal refresh timing requires balancing competing factors: declining performance, increasing support costs, user productivity, security risks, and capital availability. Organizations that refresh too frequently waste capital; those that wait too long suffer productivity losses that exceed hardware savings.
Management Approach:
Hardware expense management typically works well in-house using IT Asset Management (ITAM) tools like ServiceNow, Flexera, or Snow Software. These platforms track inventory, automate lifecycle workflows, and provide cost visibility. Outsourcing hardware TEM makes sense primarily for asset-heavy organizations (manufacturing, retail) with thousands of endpoints requiring specialized depot repair, imaging, and logistics services.
4. IT Professional Services Expense Management
What It Covers:
- • IT consulting and advisory services
- • Managed services providers (MSPs)
- • Outsourcing arrangements (ITO, BPO)
- • Staff augmentation and contractors
- • Professional development and training
- • Project-based implementation services
Key Metrics:
- • Typical spend: Highly variable (10-30% of IT budget)
- • Optimization potential: 15-20% through consolidation
- • Average vendors: 8-15 professional services firms
- • Contract types: Fixed-price, T&M, outcome-based
- • Management complexity: High (relationship-intensive)
Professional Services Complexity Factors:
Vendor proliferation. Professional services purchases typically occur project-by-project, leading to vendor proliferation. An enterprise might simultaneously engage 8-15 consulting firms, managed services providers, and staff augmentation firms, each with different rate cards, contract terms, and performance standards.
Statement of Work (SOW) tracking. Unlike recurring subscriptions, professional services involve unique SOWs for each engagement. Tracking which SOWs are active, actual spending against SOW budgets, scope change management, and deliverable completion requires dedicated contract management infrastructure often absent at mid-market companies.
Performance and value measurement. Measuring ROI on professional services is inherently subjective. Unlike telecom (where cost reduction is measurable) or cloud (where resource utilization is trackable), professional services deliver strategic value, knowledge transfer, and capability building that resist simple metrics. This measurement challenge makes optimization difficult.
Management Approach:
IT professional services expense management works best as a collaboration between procurement (contract management, rate negotiation, vendor consolidation) and IT leadership (scope definition, performance management, strategic alignment). Vendor management platforms help track SOWs, spending, and performance. Optimization focuses on vendor consolidation, rate card standardization, and preferred vendor programs.
TEM Category Comparison: Where to Focus First
| Category | Optimization Potential | Complexity | Typical Priority |
|---|---|---|---|
| Telecom | 25-35% savings | Very High | First Priority |
| SaaS/Cloud | 15-25% savings | High | Second Priority |
| Professional Services | 15-20% savings | High (relationship) | Third Priority |
| Hardware | 10-15% savings | Moderate | Ongoing/Parallel |
Strategic insight: Telecom delivers the highest optimization ROI despite (or because of) its complexity. Organizations that tackle telecom first generate quick wins that fund broader TEM initiatives and build organizational confidence for addressing other categories.
Why Telecom is the Most Complex TEM Category
While all technology expense categories present management challenges, telecom stands apart in complexity—and that complexity directly correlates with optimization opportunity. Understanding why telecom is uniquely difficult helps explain why it consistently delivers 25-35% cost reduction, the highest ROI of any TEM category.
This is precisely why organizations partner with specialized telecom expense management providers who combine deep carrier expertise with proven optimization methodologies—achieving results that internal teams and generalist consultants simply cannot match.
1Contract Structures: The 40-Page Labyrinth
Telecom contracts represent some of the most complex commercial agreements in enterprise procurement. A typical Master Service Agreement (MSA) with a Tier 1 carrier runs 40-60 pages and includes:
- Hundreds of individual line items with separate pricing schedules, each subject to different terms
- Multiple pricing mechanisms within a single contract (fixed monthly, usage-based, tiered, committed use)
- Nested dependencies where Service Order B's pricing depends on commitments made in Service Order A
- Auto-renewal clauses triggered 90-180 days before term expiration (often missed by in-house teams)
- Early termination fees calculated using proprietary formulas that obscure actual costs
- Price protection mechanisms that limit annual increases but often include loopholes
Even experienced procurement professionals struggle with telecom contracts because carriers use non-standard language, bury unfavorable terms in technical appendices, and structure agreements to maximize lock-in. Critical terms like "committed use" obligations, service-level agreement (SLA) credits, and installation fee waivers hide in fine print.
Compare to other categories:
SaaS contracts typically run 8-15 pages with straightforward annual subscription pricing. Most enterprise SaaS agreements use standardized terms with clear per-user or per-instance pricing. Auto-renewal clauses exist but are more transparent.
Cloud services use simple pay-as-you-go models with public pricing. While committed use discounts add complexity, pricing is algorithmic and verifiable. Contracts are brief, focusing primarily on service levels and data protection.
This contract complexity creates two problems: (1) organizations unknowingly accept unfavorable terms that cost 15-20% more than market rates, and (2) they fail to exercise contract rights (like SLA credits or cancellation windows) that could reduce costs. Specialized telecom expense management expertise is often required to identify these buried landmines.
2Multi-Carrier Reality: Managing the Vendor Maze
Unlike cloud infrastructure (where enterprises typically consolidate to 1-3 providers) or SaaS (where proliferation occurs but vendors are easily substituted), telecom requires multi-carrier environments by necessity:
Geographic coverage gaps. No single carrier provides optimal coverage in all markets. AT&T might dominate in the Northeast, while Verizon leads in the Southeast, and Lumen excels in rural markets. Organizations with national or international footprints must maintain relationships with 3-7 carriers simply to ensure connectivity everywhere they operate.
Redundancy and business continuity. Mission-critical sites require diverse network paths from multiple carriers to prevent single points of failure. A data center might have primary connectivity from Carrier A and failover from Carrier B, both of which must be actively managed, monitored, and optimized.
Service-specific strengths. Carriers specialize: some excel at mobile services, others at MPLS networks, still others at international connectivity or SD-WAN. Organizations optimize cost and performance by selecting best-of-breed carriers for different service categories, inevitably creating vendor proliferation.
Legacy contract obligations. Multi-year telecom contracts (3-7 year terms are common) create vendor lock-in. Even when an enterprise wants to consolidate carriers, existing contract commitments force them to maintain multiple relationships until legacy agreements expire.
This multi-carrier environment creates exponential management complexity:
- • Each carrier has unique billing formats, payment portals, and invoice cycles
- • Service tickets must be opened through carrier-specific systems with different protocols
- • Contract renewal dates are staggered across vendors, requiring continuous negotiation
- • Performance monitoring requires integrating data from multiple carrier dashboards
- • Relationship management demands maintaining executive connections at 3-7 organizations
Compare to other categories:
Cloud infrastructure consolidation is not only possible but recommended. Most enterprises successfully operate with 2-3 cloud providers (AWS, Azure, GCP) and can easily reduce to a single primary cloud. Multi-cloud adds cost without commensurate benefit in most scenarios.
SaaS applications proliferate (130+ apps typical) but are independently managed. Adding or removing a SaaS vendor doesn't create dependencies. Telecom carriers, by contrast, must be orchestrated together to deliver complete network connectivity.
The multi-carrier reality means telecom expense management cannot be solved by simple vendor consolidation. Instead, it requires sophisticated multi-vendor orchestration, relationship management across carriers, and continuous arbitrage between competing offers—expertise that in-house IT teams rarely possess.
3Legacy Infrastructure: The 30-Year Technology Tail
Enterprise telecom environments routinely include infrastructure installed in the 1990s and 2000s, creating a technology debt burden absent from cloud, SaaS, or modern hardware categories. This legacy infrastructure dramatically complicates expense management and optimization.
POTS lines (Plain Old Telephone Service) remain surprisingly common. Enterprises maintain analog telephone lines for:
- • Elevator emergency phones (fire code requirements)
- • Building security systems (alarm monitoring)
- • Fax machines (healthcare, legal still depend on fax)
- • Point-of-sale systems (retail credit card terminals)
- • Fire suppression systems (code compliance)
These POTS lines cost $40-80 per line monthly—vastly more expensive than VoIP alternatives—but replacement requires coordinating with facilities teams, fire marshals, alarm monitoring companies, and local inspectors. The technical migration is simple; the organizational complexity is paralyzing. Result: enterprises continue paying premium rates for 1960s technology.
TDM circuits and MPLS networks represent partially-completed IP migrations. Many organizations began moving from Time Division Multiplexing (TDM) circuits to IP-based connectivity in the 2010s but stalled midway. They now operate hybrid environments with some sites on modern SD-WAN and others still using TDM or MPLS—often paying 3-5x market rates for legacy circuits that carriers no longer actively support.
On-premise PBX systems installed 15-20 years ago continue operating, requiring specialized telecom engineers to maintain. While cloud-based UCaaS platforms offer superior functionality at lower cost, replacing on-premise PBX systems requires capital investment, user training, and potential disruption—barriers that keep legacy infrastructure in place for years.
Compare to other categories:
Cloud services have no legacy infrastructure debt. Organizations start fresh with modern platforms. Even "legacy" cloud workloads are only 10-15 years old at most, and cloud providers continuously upgrade infrastructure without customer intervention.
SaaS applications are always current. Vendors deliver updates automatically, eliminating version fragmentation. There's no SaaS equivalent of "we're still running a 1997 telephone system."
Legacy telecom infrastructure creates a vicious cycle: (1) outdated technology costs more due to carrier "end of life" pricing premiums, (2) replacement requires cross-functional coordination that stalls projects, (3) costs continue escalating while organizations delay migration, and (4) technical debt accumulates. Breaking this cycle requires dedicated expertise, project management, and executive sponsorship—resources often unavailable for in-house TEM efforts.
4Regulatory Compliance: Navigating a Legal Minefield
Telecom services carry unique regulatory obligations that other technology categories largely avoid. These regulations add direct costs (taxes, compliance fees) and indirect costs (internal compliance overhead, audit requirements, legal review).
Federal Communications Commission (FCC) regulations govern telecom providers and, by extension, impact enterprise customers. FCC rules dictate everything from service availability to accessibility requirements (like TTY support for hearing-impaired users). Enterprises must ensure their telecom configurations comply with FCC mandates, particularly around:
- • E911 location accuracy for mobile and VoIP services
- • CALEA (Communications Assistance for Law Enforcement Act) compliance for lawful intercept capability
- • Truth-in-billing requirements that affect invoice formatting and fee disclosure
- • Accessibility standards (Section 255, Section 716) for disabled employees
State and local telecom taxes create a compliance nightmare. Unlike SaaS (largely exempt from sales tax in most states) or cloud services (subject to standard sales tax), telecom services face specialized taxes that vary by jurisdiction:
- • State telecommunications excise taxes (rates from 0% to 18% depending on state)
- • Municipal gross receipts taxes (particularly complex in Texas, Louisiana, Alabama)
- • Universal Service Fund (USF) fees (federal, state, and sometimes local)
- • Right-of-way fees for fiber and cable installations
- • 911 surcharges (vary by city and county)
Calculating these taxes correctly requires jurisdiction-level precision—different tax rates apply depending on the physical address of the service delivery point. A company with 500 locations faces 500 different tax calculations. Carriers frequently apply incorrect tax rates, but enterprises lack in-house expertise to audit tax accuracy. Studies show 8-12% of telecom bills involve tax errors.
International regulations add another layer. Enterprises with global operations must navigate:
- • GDPR (Europe) data sovereignty requirements affecting telecom data storage
- • Country-specific telecom licensing (required in China, India, Middle East)
- • Cross-border data transfer restrictions (impacting cloud communications)
- • Local content and routing regulations (telecom traffic must stay in-country)
Compare to other categories:
SaaS and cloud face minimal industry-specific regulation. Standard software sales tax applies (or doesn't, in many states). Data privacy regulations (GDPR, CCPA) apply uniformly across technology categories, not uniquely to SaaS.
Hardware purchases involve straightforward sales tax. No specialized telecom taxes, no FCC compliance, no municipal fees. Tax audit is simple: sales tax rate times purchase price.
The regulatory complexity of telecom creates ongoing compliance costs (legal review, tax audit, policy development) and amplifies the risk of non-compliance penalties. Organizations without specialized telecom expertise routinely overpay taxes, miss tax exemption opportunities, or face compliance violations—all of which drive up total cost of ownership.
5Usage Variability: The Budgeting Wild Card
Unlike the predictable costs of SaaS subscriptions or hardware leases, telecom expenses fluctuate month-to-month based on usage patterns, creating budgeting challenges and hiding cost overruns.
International roaming charges represent the most volatile cost category. A single executive traveling internationally can generate $2,000-5,000 in roaming charges in a week—charges that appear 45-60 days after the travel occurred (due to carrier billing lag). Organizations discover massive roaming bills long after employees return, when challenging charges is difficult.
Common scenarios include:
- • Cruise ship roaming (maritime satellite networks) costing $15-30 per megabyte
- • Automatic data roaming enabled by default on smartphones
- • Conference attendees in international venues with inadequate Wi-Fi
- • Business travel to countries without roaming agreements with US carriers
Overage charges for metered services add unpredictability. Despite most telecom services moving toward unlimited pricing, metered billing persists for:
- • Data circuits with committed information rates (CIR) and burst pricing
- • Mobile plans with data caps (overages cost $10-15 per gigabyte)
- • Toll-free number usage (per-minute charges that vary by caller location)
- • International calling (per-minute rates that differ by country)
These overage charges are often opaque. Employees don't receive real-time notifications when approaching usage thresholds. Bills arrive 30-45 days after usage, making it impossible to retroactively control spending.
Seasonal variation affects certain industries:
- • Retail: peak bandwidth usage during holiday shopping season
- • Education: summer shutdown periods with minimum usage
- • Accounting/tax: Q1 peak for tax preparation firms
- • Hospitality: geographic seasonality (ski resorts, beach properties)
Compare to other categories:
Cloud infrastructure costs vary with usage, but cloud platforms provide real-time cost visibility, usage alerts, and budget enforcement tools. Organizations can set spending limits and receive instant notifications when approaching thresholds. Billing lag is 24-48 hours, not 30-45 days.
SaaS subscriptions are entirely predictable: fixed per-user monthly fees. Even usage-based SaaS pricing (rare) provides real-time dashboards. There's no SaaS equivalent of surprise $5,000 roaming bills.
Usage variability makes telecom budgeting a guessing game. Finance teams establish budgets based on historical averages, then face 20-30% variance when usage spikes occur. This variability also masks cost optimization opportunities—when spending fluctuates naturally, it's hard to distinguish normal variation from billing errors or service inefficiencies.
6Billing Errors: The 73% Problem
Industry studies consistently show that 73% of enterprise telecom bills contain errors—a staggering rate that dwarfs billing accuracy in other technology categories. These errors typically add 5-12% to telecom costs annually.
Common billing errors include:
- •Services billed after disconnection. Enterprises cancel services but continue receiving charges for 6-18 months afterward. Carriers require specific disconnection processes (formal service orders, account numbers, circuit IDs), and missing any step means billing continues indefinitely.
- •Duplicate charges. The same service appears on multiple bills or under different line item descriptions, making detection difficult without detailed invoice analysis.
- •Rate discrepancies. Contract rates don't match billed rates. A service contracted at $500/month bills at $650/month, often buried in hundreds of other line items.
- •Taxes and fees miscalculations. Incorrect tax jurisdictions applied, or fees charged that should be exempt. Tax errors alone account for 15-20% of total billing mistakes.
- •Service never ordered. Charges appear for services the enterprise never authorized, often resulting from carrier provisioning errors or fraudulent orders.
- •Promotional rate expirations. Introductory rates expire and revert to standard pricing without notification. A $200/month promotional rate becomes $450/month, and billing simply reflects the increase.
Why is telecom billing accuracy so poor? Several factors contribute:
System fragmentation. Large carriers operate billing systems acquired through decades of mergers. AT&T's billing infrastructure includes systems from legacy AT&T, Cingular, BellSouth, and others—none of which fully integrate. Service orders entered in one system may not properly sync with billing systems, creating discrepancies.
Manual processes. Despite automation in other industries, telecom provisioning and billing still involve significant manual data entry. Humans transpose account numbers, select wrong rate plans, or fail to complete disconnection orders.
Complexity enables errors. With hundreds of line items per invoice, thousands of rate plans, and millions of potential configurations, billing errors are statistically inevitable. Carriers lack economic incentive to invest in billing accuracy when enterprises don't systematically audit invoices.
Compare to other categories:
Cloud platforms achieve 99%+ billing accuracy. Cloud billing is automated, API-driven, and algorithmically calculated. Usage meters are precise, pricing is transparent, and bills are easily auditable through dashboards. Billing disputes are rare and quickly resolved.
SaaS subscriptions are simple to audit: count active users, multiply by per-user price. Billing errors are typically limited to user count discrepancies (far easier to identify and correct than telecom line item audits).
The 73% error rate means every enterprise telecom bill should be audited every month. Yet in-house teams rarely have capacity for systematic auditing. Line-by-line invoice review requires 40-80 hours monthly for organizations with $1M+ annual telecom spend—time that internal IT teams simply don't have. Result: billing errors compound month after month, year after year.
Specialized telecom expense management providers recover an average of $12 for every $100 in annual telecom spend simply by identifying and disputing billing errors. This error-recovery ROI alone often justifies outsourced TEM—before considering contract optimization, rate plan improvements, or service rationalization.
The Complexity-ROI Connection
Here's the counterintuitive truth about technology expense management: the most complex category delivers the highest optimization ROI.
Telecom's 25-35% average cost reduction dramatically exceeds the 10-20% typical for other TEM categories. Why? Because complexity creates optimization opportunity:
- Contract complexity means most enterprises unknowingly accepted unfavorable terms
- Multi-carrier environments create arbitrage opportunities through competitive leverage
- Legacy infrastructure hides massively overpriced services awaiting replacement
- Billing errors compound into millions of dollars annually at large enterprises
- Usage variability masks service inefficiencies and optimization gaps
This is why sophisticated TEM strategies start with telecom: complexity creates opportunity, and opportunity drives ROI.
Ready to Tackle Your Telecom Complexity?
Get a free telecom expense assessment from Socium's team of specialists. We'll analyze your current environment, identify immediate savings opportunities, and show you exactly how much optimization potential exists in your telecom spend.
Start Your Free AssessmentNo obligation. Typical assessment identifies 25-35% in savings opportunities.
TEM Maturity Model: Where Is Your Organization?
Technology expense management effectiveness exists on a continuum from chaotic reactive management to strategic continuous optimization. Understanding your organization's current maturity level helps prioritize improvements and set realistic transformation timelines. Most enterprises operate at Level 2-3; fewer than 15% achieve Level 4-5 maturity.
Level 1: Reactive/Ad-Hoc
Estimated 30% of enterprises operate at this level
Characteristics:
- •Pay bills when they arrive with minimal review or validation
- •No centralized visibility into total technology spending across categories
- •Decentralized procurement with departments purchasing independently
- •No optimization efforts beyond ad-hoc vendor complaints
- •Multiple approvers with no defined process or authority matrix
- •Reactive problem-solving only when issues escalate to executives
Financial Impact:
Organizations at Level 1 typically overspend 20-40% compared to optimized benchmarks. For a company with $10M annual technology budget, this represents $2-4M in annual waste.
Where to Start:
Conduct a telecom expense audit first. Telecom delivers the fastest ROI and requires minimal internal infrastructure. A 90-day telecom audit typically identifies 25-35% savings opportunities and demonstrates TEM value to executive sponsors. Use telecom success to fund expansion into other categories.
Level 2: Basic Tracking
Estimated 35% of enterprises operate at this level
Characteristics:
- •Centralized invoice payment through accounting/AP systems
- •Expense tracking in spreadsheets maintained by individual administrators
- •Some vendor management with designated points of contact
- •Periodic review cycles (quarterly or annually) for cost analysis
- •Basic budget planning using historical spending patterns
- •Manual invoice auditing limited to obvious errors or large variances
Financial Impact:
Level 2 organizations overspend 15-25% compared to optimized benchmarks. Improved visibility helps, but lack of systematic optimization and reliance on manual processes limits cost control effectiveness.
Next Steps:
Implement dedicated TEM tools for high-spend categories (start with telecom if >$1M annual spend). Establish formal governance with defined approval workflows and budget accountability. Create a cross-functional TEM committee with representatives from IT, finance, and procurement.
Level 3: Systematic Management
Estimated 20% of enterprises operate at this level
Characteristics:
- •TEM tools implemented for major spending categories with automated tracking
- •Regular optimization reviews on monthly or quarterly cadence
- •Defined processes and ownership with clear RACI (Responsible, Accountable, Consulted, Informed) matrix
- •Vendor performance management with SLAs and quarterly business reviews
- •Benchmark comparison against industry standards and peer organizations
- •Contract lifecycle management with renewal tracking and competitive bidding
Financial Impact:
Level 3 organizations overspend 10-15% compared to best-in-class. Systematic processes and tools deliver meaningful optimization, but gaps remain in proactive management and cross-category integration.
Next Steps:
Integrate TEM across all technology categories rather than managing in silos. Implement predictive analytics to identify cost trends before they escalate. Develop strategic technology roadmap that aligns spending with business outcomes. Consider outsourcing complex categories (like telecom) to specialists while maintaining in-house expertise for simpler categories.
Level 4: Strategic Optimization
Estimated 12% of enterprises operate at this level
Characteristics:
- •Proactive cost management with continuous optimization vs. periodic reviews
- •Data-driven decision making using advanced analytics and predictive modeling
- •Cross-functional collaboration with IT, finance, procurement, and business units aligned
- •Technology roadmap explicitly tied to business strategy and value creation
- •Executive visibility with regular reporting to CIO, CFO, and board
- •Strategic vendor partnerships moving beyond transactional relationships
Financial Impact:
Level 4 organizations overspend just 5-10% compared to theoretical optimal. Most cost gaps represent conscious trade-offs (paying premium for superior service, strategic vendor relationships, or faster time-to-market).
Next Steps:
Move toward automated optimization using AI/ML for anomaly detection and recommendation engines. Implement real-time cost visibility dashboards. Develop business case methodology that quantifies technology investments in business outcome terms (revenue impact, customer experience, competitive advantage) rather than pure cost metrics.
Level 5: Continuous Transformation
Estimated 3% of enterprises achieve this level
Characteristics:
- •Real-time expense optimization with automated policy enforcement
- •Predictive analytics forecasting cost trends 6-12 months ahead
- •Automated optimization for routine decisions (rightsizing, license harvesting, contract renewals)
- •Strategic business partner where TEM enables competitive advantage
- •FinOps culture with shared accountability across organization
- •Continuous innovation testing new technologies, vendors, and optimization approaches
Financial Impact:
Level 5 organizations operate at <5% above theoretical optimal. Remaining gaps are intentional investments in innovation, strategic positioning, or risk mitigation. These organizations view TEM as competitive advantage, not just cost control.
Characteristics of Best-in-Class:
Level 5 organizations have elevated TEM from a tactical finance function to a strategic capability that enables faster innovation, better business outcomes, and competitive differentiation. Technology spending aligns explicitly with business value creation. The TEM function operates as a trusted advisor to the C-suite on technology strategy, not just a cost-cutting operation.
Self-Assessment Checklist
Answer these questions to determine your organization's TEM maturity level:
📊 Visibility
Can you produce a comprehensive technology spending report within 24 hours showing all categories, vendors, and cost trends?
🔍 Optimization
When was your last telecom expense audit? Do you systematically review bills monthly for errors?
📋 Governance
Do you have defined approval workflows, spending thresholds, and accountability for technology purchasing?
🛠️ Tools
Have you implemented TEM software or do you rely on spreadsheets and manual tracking?
🤝 Vendor Management
Do you conduct quarterly business reviews with major technology vendors? Track performance against SLAs?
📈 Strategic Alignment
Can you articulate how technology spending connects to business outcomes and strategic priorities?
Scoring: If you answered "no" to most questions, you're likely at Level 1-2. Mixed answers suggest Level 3. "Yes" to most indicates Level 4+.
In-House vs. Outsourced TEM by Category
One of the most consequential decisions in technology expense management is determining which categories to manage internally versus outsourcing to specialists. This decision varies significantly by category based on complexity, required expertise, and organizational capabilities. Making the wrong choice costs millions annually in inefficiency or missed optimization.
| Category | In-House Viable? | When to Outsource | Hybrid Approach |
|---|---|---|---|
| Telecom | ❌ Rarely (too complex) | >$1M annual spend, multi-carrier environment, >100 locations | Annual audit + ongoing monitoring by specialist |
| SaaS/Cloud | ✅ Often (tools available) | >$5M annual spend, complex multi-cloud, limited internal expertise | FinOps tools + occasional consulting |
| Hardware | ✅ Yes (ITAM tools) | Asset-heavy orgs (>10,000 endpoints), specialized logistics needs | ITAM tools + depot services |
| Professional Services | ✅ Yes (procurement) | Complex vendor ecosystem (>15 firms), lack of procurement discipline | Strategic sourcing consulting |
Telecom: The Strong Case for Outsourcing
Of all TEM categories, telecom presents the most compelling argument for outsourcing due to its unique complexity and specialized expertise requirements. Here's why in-house telecom expense management rarely succeeds:
Complexity Requires Specialized Expertise
Effective telecom expense management demands deep knowledge across multiple domains:
- • Carrier-specific contract language and pricing structures (varies by carrier)
- • Regulatory compliance including FCC regulations, state/local taxes, international requirements
- • Technical architecture understanding MPLS, SD-WAN, SIP, TDM, fiber, wireless technologies
- • Billing system expertise to navigate each carrier's invoice format and dispute process
- • Carrier relationship management and negotiation leverage
Building this expertise in-house requires hiring specialized staff—a dedicated Telecom Expense Manager costs $90,000-130,000 annually, plus benefits, overhead, and training. For organizations with <$5M annual telecom spend, this overhead exceeds the value created.
Carrier Relationships Matter
Specialized telecom expense management firms bring pre-existing carrier relationships that deliver tangible value. They maintain executive connections at AT&T, Verizon, Lumen, and other major carriers, enabling faster issue resolution, better contract terms, and insider knowledge of upcoming pricing changes or promotional offers. A single enterprise, no matter how large, has limited leverage compared to a TEM firm representing 30+ enterprise clients.
Full-Time Focus Drives ROI
In-house IT teams inevitably prioritize urgent operational issues over systematic telecom optimization. A network outage demands immediate attention; a billing error that's been occurring for 18 months gets deprioritized indefinitely. Specialized TEM providers focus exclusively on optimization, conducting monthly invoice audits, tracking all contract renewal dates, and proactively identifying cost reduction opportunities. This full-time focus delivers 5:1 ROI or better—$5 in savings for every $1 in service fees.
Managed Services ROI Analysis:
Typical enterprise with $2M annual telecom spend:
- • Year 1 optimization: 30% reduction = $600,000 savings
- • Service fee: 15-20% of savings = $90,000-120,000
- • Net Year 1 benefit: $480,000-510,000
- • Ongoing annual fee: $50,000-75,000 for monitoring/management
- • Ongoing annual benefit: Maintain optimized rates, prevent billing errors, manage renewals
Three-year total ROI: Typically 800-1200%
When In-House Makes Sense
In-house telecom expense management can work for organizations with: (1) <$500K annual telecom spend (below minimum thresholds for most TEM providers), (2) simple single-carrier environments, (3) dedicated internal telecom expertise, and (4) sufficient staff capacity. This describes perhaps 5-10% of enterprises. For the remaining 90%+, outsourced telecom expense management delivers superior results at lower total cost.
Learn more about the benefits of outsourced telecom expense management in our detailed guide: Why Enterprises Choose Outsourced Telecom Expense Management
SaaS/Cloud: Often Manageable In-House
Unlike telecom, SaaS and cloud expense management typically works well as an in-house function due to tool availability, simpler audit processes, and alignment with existing IT skillsets.
FinOps Tools Enable Self-Management
The FinOps (Financial Operations) movement has produced mature platforms for SaaS and cloud expense management. Tools like Flexera, CloudHealth (VMware), Apptio, and native cloud cost management features (AWS Cost Explorer, Azure Cost Management, GCP Cost Management) provide:
- • Real-time cost visibility and dashboards
- • Automated rightsizing recommendations
- • Budget alerts and policy enforcement
- • Resource tagging and chargeback capabilities
- • Reserved instance/savings plan analysis
These tools empower technical teams to self-manage cloud costs without specialized external expertise. A competent cloud architect can implement meaningful optimization using platform-native tools.
When to Outsource SaaS/Cloud TEM
Outsourcing makes sense when:
- • Massive scale: >$5M annual cloud spend overwhelming internal teams
- • Multi-cloud complexity: Operating in AWS + Azure + GCP with limited cross-platform expertise
- • Lack of internal capacity: Cloud architects focused on building, not optimizing
- • Rapid cost growth: 50%+ year-over-year increases indicating lack of control
Even when outsourcing, the model differs from telecom. SaaS/cloud TEM consulting typically involves short-term engagements (3-6 months) to implement FinOps processes and tools, then transition to in-house management with occasional advisory support.
Total Cost of Ownership: Build vs. Buy
When evaluating in-house vs. outsourced TEM, calculate total cost of ownership (TCO) including all hidden costs:
In-House TEM Costs:
- ✓ Staff salaries + benefits (TEM Manager: $90-130K)
- ✓ TEM software licenses ($25-75K annually)
- ✓ Training and professional development
- ✓ Overhead allocation (HR, facilities, IT support)
- ✓ Opportunity cost (staff time on TEM vs. strategic initiatives)
- ✓ Learning curve inefficiency (6-12 months to proficiency)
Typical annual TCO: $150,000-250,000
Outsourced TEM Costs:
- ✓ Initial assessment/audit fees (often success-based)
- ✓ Performance-based fees (% of savings achieved)
- ✓ Ongoing management fees (flat monthly or annual)
- ✓ Minimal internal coordination time
- ✓ Immediate expertise (no learning curve)
- ✓ Risk transfer (provider accountable for results)
Typical annual TCO: $50,000-120,000 (for $2M telecom spend)
Key insight: For telecom specifically, outsourced TCO is typically 40-60% lower than in-house while delivering 2-3x better optimization results. This is why 80%+ of enterprises with sophisticated TEM programs outsource telecom while managing other categories in-house.
Building Your Integrated TEM Strategy
The most effective technology expense management programs integrate across all categories rather than managing each in isolation. Integration delivers synergies: lessons learned in one category apply to others, vendor consolidation opportunities emerge, and executive visibility improves. Here's how to build an integrated TEM strategy that maximizes ROI.
Prioritize by Impact and Complexity
Don't attempt to optimize all technology spending simultaneously. Instead, sequence your TEM efforts based on financial impact and organizational readiness.
Recommended Sequencing:
Phase 1 (Months 1-6): Start with Telecom
Why first: Highest ROI potential (25-35% savings), generates quick wins that fund broader TEM, demonstrates value to executive sponsors, builds organizational confidence.
Approach: Engage specialized telecom expense management provider for comprehensive audit. Use success-based pricing to minimize risk. Target 90-120 day timeline for initial results.
Phase 2 (Months 7-12): SaaS Governance
Why second: Leverage momentum from telecom success, growing cost category requiring control, relatively straightforward with available tools.
Approach: Implement SaaS management platform (Zylo, Productiv, Torii), establish approval workflows, conduct license harvesting, negotiate enterprise agreements for high-usage applications.
Phase 3 (Year 2): Hardware Optimization & Services Management
Why later: Lower ROI relative to telecom and SaaS, requires longer-term planning (refresh cycles), can be managed in parallel with ongoing optimization of other categories.
Approach: Optimize refresh cycles, implement ITAM tools, consolidate professional services vendors, establish preferred vendor programs.
⚡ Quick Wins Strategy
Organizations that start with telecom generate $500K-2M in Year 1 savings for typical enterprises. These savings fund implementation of SaaS tools, ITAM platforms, and ongoing TEM resources—creating a self-funding improvement cycle. Starting with lower-ROI categories requires budget allocation, creating friction and slowing momentum.
Establish Ownership and Governance
Technology expense management fails when ownership is unclear or fragmented. Successful TEM requires explicit accountability, cross-functional collaboration, and executive sponsorship.
Who Should Own TEM?
Three organizational models prevail, each with trade-offs:
Model 1: CIO Office (Strategic Focus)
Pros: Aligns technology spending with technology strategy, leverages IT's technical expertise, natural ownership of vendor relationships
Cons: IT may lack financial rigor, potential conflict between optimization (reduce spend) and innovation (increase capability)
Best for: Organizations where technology is core to competitive advantage and innovation outweighs cost control
Model 2: CFO Office (Financial Focus)
Pros: Strong financial discipline, budget accountability, expertise in vendor contract analysis and negotiation
Cons: May lack technical expertise to evaluate architecture decisions, risk of optimizing costs at expense of capability
Best for: Cost-conscious organizations facing margin pressure where financial optimization is paramount
✅ Model 3: Shared Services / Joint CIO-CFO (Recommended)
Pros: Balances technical and financial expertise, creates shared accountability, aligns optimization with business value
Cons: Requires strong collaboration between IT and Finance (challenging in siloed organizations), needs executive sponsorship
Best for: Most enterprises, particularly those with mature IT and Finance functions
Cross-Functional Team Structure
Regardless of primary ownership, effective TEM requires a cross-functional team:
- •Executive Sponsor (CIO or CFO): Provides air cover, resolves escalations, secures budget
- •TEM Program Manager: Day-to-day coordination, vendor management, reporting
- •IT Representative: Technical architecture input, solution evaluation
- •Finance Representative: Budget analysis, contract review, business case development
- •Procurement Representative: Vendor negotiations, sourcing strategy
- •Business Unit Representatives (as needed): Requirements definition, solution adoption
Sample RACI Matrix for TEM
| Activity | CIO | CFO | TEM Manager | Procurement |
|---|---|---|---|---|
| Set TEM strategy | A | A | R | C |
| Monthly invoice audit | I | I | R/A | C |
| Contract negotiations | C | A | R | R |
| Technology selection | A | C | R | C |
R = Responsible, A = Accountable, C = Consulted, I = Informed
Select Tools and Partners by Category
Tool selection varies dramatically by category. What works for SaaS management is irrelevant for telecom optimization. Tailor your technology stack and partner ecosystem to each category's unique requirements.
📞 Telecom: Managed Services Approach
Recommended approach: Outsource to specialized telecom expense management provider
Why: Complexity requires full-time focus, specialized expertise, and carrier relationships unavailable in-house. ROI justifies service fees.
Partner selection criteria:
- • Success-based or performance-based pricing (align incentives)
- • Telecom-specific expertise (not general IT consultants)
- • Proven methodology for multi-carrier environments
- • Technology platform for invoice processing and tracking
- • Client references in your industry and company size
Learn more: Comprehensive Guide to Telecom Expense Management
☁️ SaaS/Cloud: FinOps Platforms
Recommended approach: Implement FinOps platform with in-house management
Tool categories:
- • SaaS Management: Zylo, Productiv, Torii, Zluri
- • Cloud Cost Management: CloudHealth (VMware), Apptio Cloudability, Spot by NetApp
- • Native Cloud Tools: AWS Cost Explorer, Azure Cost Management, GCP Cost Management
When to add consulting: Initial setup, complex multi-cloud optimization, massive scale (>$5M spend)
💻 Hardware: ITAM Tools
Recommended approach: IT Asset Management platform integrated with service management
Leading platforms:
- • Enterprise: ServiceNow ITAM, BMC Helix, Ivanti
- • Mid-market: Flexera, Snow Software, Asset Panda
- • Cloud-native: Oomnitza, Device42
Integration focus: Connect ITAM with procurement, finance (ERP), and service desk for complete lifecycle visibility
👥 Professional Services: Procurement Systems
Recommended approach: Vendor management system (VMS) or services procurement module
Platform options:
- • VMS platforms: Fieldglass (SAP), Beeline, Workday VNDLY
- • Procurement suites: Coupa, Ariba, Oracle Procurement Cloud
- • Specialized: Tropic (SaaS procurement), Vendr, Vertice
Key capability: SOW tracking, rate card management, performance scorecards
Ready to Build Your Integrated TEM Strategy?
Schedule a consultation with Socium's TEM strategists. We'll assess your current state across all technology categories, identify optimization priorities, and build a customized roadmap that starts with quick wins (telecom) and expands systematically.
Schedule Strategy SessionFree 30-minute assessment. No sales pressure, just strategic guidance.